Overall, Nucor demonstrates strong business quality through its commitment to safety, robust financial health, and disciplined capital allocation. Future prospects remain positive, driven by significant growth initiatives and favorable market demand, although pricing pressures from the market pose challenges.
Analysis Date: January 28, 2025 Last Updated: May 29, 2025
+241%
+13.1% per year
Past performance does not guarantee future results. The data presented is indicative and may not be updated in real-time.
CountryUS
ExchangeNYSE
IndustrySteel
SectorBasic Materials
Market Cap$28.32B
CEOMr. Leon J. Topalian
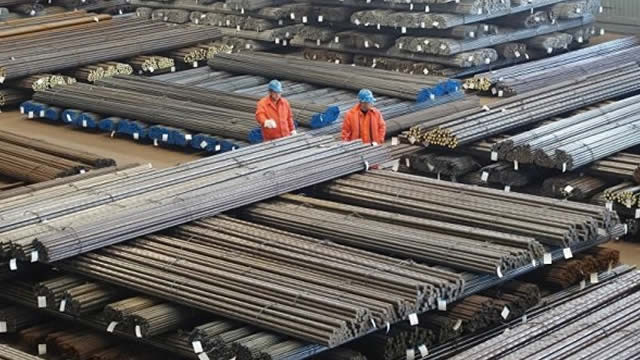
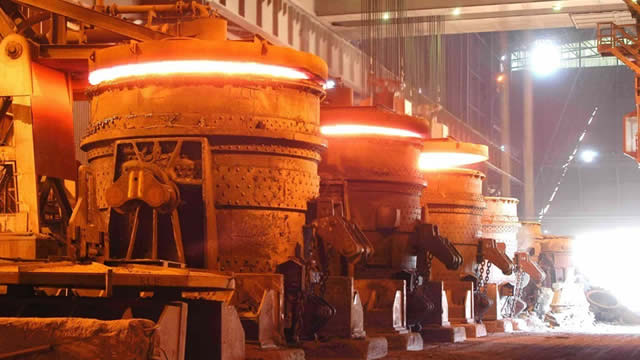
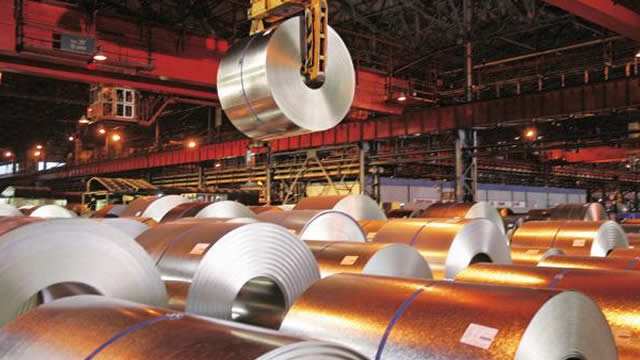
Nucor Corporation is a company that makes steel and steel products. They produce many different types of steel, which are used in buildings, cars, and other structures. Nucor sells their steel to various businesses in the United States, Canada, and Mexico, helping to build things like roads, bridges, and homes. They also recycle metal and produce raw materials for making steel, contributing to a more sustainable industry.
Streams of revenue
Sheet:32%
Bar:19%
Steel Products:13%
Structural:8%
Raw Materials:7%
Rebar Fabrication:7%
Plate:7%
Tubular Products:4%
Deck:4%
Geographic Distribution
All Other:100%
Core Products
🔩
Steel BarsReinforcement bars
🏗️
Steel BeamsStructural beams
🛡️
Steel PlatesThick steel plates
📄
Steel SheetsFlat steel sheets
🛢️
Steel TubingHollow steel tubes
Business Type
Business to Business
Competitive Advantages
Unlock Competitive Advantages Analysis
Discover all competitive advantages and strategic moats that protect NUE's market position.
Trailing Twelve Months (TTM) values provide a view of the company's performance over the last year.
Graham Value Metrics
Benjamin Graham's value investing approach focuses on finding stocks with a significant margin of safety between their intrinsic value and market price.
📊
Unlock Graham value analysis
Access Benjamin Graham's value investing criteria, intrinsic value calculations, and margin of safety analysis
Trailing Twelve Months (TTM) values provide a view of the company's performance over the last year.
Income Statement Flow
Scroll horizontally to see more
About Profitability Metrics
Profitability metrics measure a company's ability to generate earnings relative to its revenue, operating costs, and other relevant metrics. Higher values generally indicate better performance.
📊
Unlock Profitability Metrics
Access detailed profitability metrics with visual gauges and benchmarks
NUE (Nucor Corporation) is a Basic Materials company listed on New York Stock Exchange. The stock has generated 13.1% annual returns with an overall investment score of None/100.
Overall, Nucor demonstrates strong business quality through its commitment to safety, robust financial health, and disciplined capital allocation. Future prospects remain positive, driven by significant growth initiatives and favorable market demand, although pricing pressures from the market pose challenges.
NUE Key Financial Metrics
NUE financial analysis includes comprehensive valuation ratios, profitability metrics, and financial health indicators. The company has a valuation score of 7.785311924587935/100 with financial health rated 8.05/100.
About Nucor Corporation
Nucor Corporation is a company that makes steel and steel products. They produce many different types of steel, which are used in buildings, cars, and other structures. Nucor sells their steel to various businesses in the United States, Canada, and Mexico, helping to build things like roads, bridges, and homes. They also recycle metal and produce raw materials for making steel, contributing to a more sustainable industry.
NUE Investment Recommendation
Based on our comprehensive analysis of NUE, investors should consider the company's strong performance track record, earnings consistency (8/10 quarters beat expectations), and current valuation metrics when making investment decisions.
Basic Materials Sector Analysis
NUE operates in the Steel industry within the Basic Materials sector. This analysis compares Nucor Corporation performance against industry and sector benchmarks to provide context for investment decisions.
Frequently Asked Questions about NUE Stock
Is NUE a good investment?
NUE (Nucor Corporation) has generated 13.1% annual returns with an overall score of None/100. Overall, Nucor demonstrates strong business quality through its commitment to safety, robust financial health, and disciplined capital allocation. Future prospects remain positive, driven by significant growth initiatives and favorable market … Investors should consider their risk tolerance and investment goals when evaluating NUE.
What is NUE P/E ratio and valuation?
NUE valuation metrics including P/E ratio, price-to-book ratio, and price-to-sales ratio are analyzed on this page with comparisons to Steel industry and Basic Materials sector benchmarks. The company currently has a valuation score of 7.785311924587935/100.
Should I buy NUE stock now?
The decision to buy NUE stock should be based on comprehensive analysis of financial metrics, market conditions, and individual investment goals. Our analysis provides , financial health score of 8.05/100, and detailed performance metrics to help inform your investment decision.
What are NUE financial health indicators?
NUE financial health analysis includes liquidity ratios, debt levels, cash flow metrics, and profitability indicators. The company has a financial health score of 8.05/100 based on comprehensive analysis of balance sheet strength and operational efficiency.
How does NUE compare to competitors?
NUE performance is benchmarked against Steel industry peers and Basic Materials sector averages. Our analysis includes comparative valuation ratios, profitability metrics, and growth indicators to provide context for Nucor Corporation's market position.
What are NUE historical returns?
NUE has generated 13.1% annual returns over the 10Y. Historical performance analysis includes price appreciation, dividend yields, and total shareholder returns compared to market benchmarks.
NUE Key Investment Metrics Summary
Annual Return: 13.1%
Valuation Score: 7.785311924587935/100
Financial Health Score: 8.05/100
Growth Score: 0.7710112342705461/100
Earnings Beat Rate: 8/10 quarters
Sector: Basic Materials
Industry: Steel
Exchange: New York Stock Exchange
Market Cap: 28323144060
NUE Investment Thesis
Nucor Corporation (NUE) represents a strong investment opportunity in the Basic Materials sector. With an overall score of None/100, the company demonstrates areas for financial improvement.
Investment Strengths
Attractive Price-to-Sales Ratio
Reasonable EV/EBITDA Ratio
Decent Return on Equity
Strong Operating Profit Margin
Strong Liquidity Ratios
Low Debt Levels
Strong Safety Performance
Robust Financial Performance
Effective Capital Allocation
Significant Growth Initiatives
Positive Market Demand Trends
Diversification in Product Offering
Investment Risks
High Price-to-Free Cash Flow Ratio
Low Net Profit Margin
Moderate Cash Ratio
Pressure from Unfair Trade Practices
Market Pricing Pressures
We use cookies to analyze site traffic and optimize your site experience.
By accepting, you consent to our use of cookies. Read our Privacy Policy to Learn more.