Northrop Grumman demonstrates strong business quality through its significant backlog, financial performance, and technological innovation. Looking forward, growth prospects are bolstered by solid guidance, international expansion, and a focus on operational efficiencies. The overall outlook appears positive based on current trends and strategic initiatives.
Analysis Date: January 30, 2025 Last Updated: May 29, 2025
+193%
+11.4% per year
Past performance does not guarantee future results. The data presented is indicative and may not be updated in real-time.
CountryUS
ExchangeNYSE
IndustryAerospace & Defense
SectorIndustrials
Market Cap$66.31B
CEOMs. Kathy J. Warden
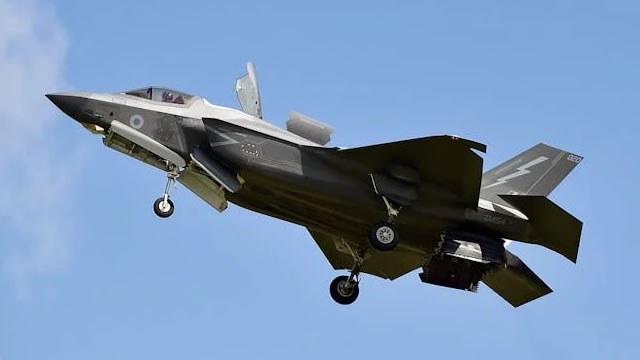
Northrop Grumman Corporation is a company that makes products for the aerospace and defense industries. They design and build various types of aircraft, including drones and fighter jets, which are used by military forces. They also create weapons systems and technology that help manage and control military operations. Additionally, they work on satellites and missile defense systems to protect against threats from space. Overall, Northrop Grumman plays a key role in ensuring safety and security through advanced technology.
Streams of revenue
Space Systems:31%
Aeronautics Systems:27%
Mission Systems:24%
Defense Systems:18%
Geographic Distribution
Europe:64%
Asia Pacific:36%
Core Products
🚀
Space SystemsSpace exploration tech
🔫
Defense SystemsWeapons & logistics
🛰️
Mission SystemsDefense electronics
✈️
Aerospace SystemsAircraft & space tech
Business Type
Business to Government
Competitive Advantages
Unlock Competitive Advantages Analysis
Discover all competitive advantages and strategic moats that protect NOC's market position.
Trailing Twelve Months (TTM) values provide a view of the company's performance over the last year.
Graham Value Metrics
Benjamin Graham's value investing approach focuses on finding stocks with a significant margin of safety between their intrinsic value and market price.
📊
Unlock Graham value analysis
Access Benjamin Graham's value investing criteria, intrinsic value calculations, and margin of safety analysis
Trailing Twelve Months (TTM) values provide a view of the company's performance over the last year.
Income Statement Flow
Scroll horizontally to see more
About Profitability Metrics
Profitability metrics measure a company's ability to generate earnings relative to its revenue, operating costs, and other relevant metrics. Higher values generally indicate better performance.
📊
Unlock Profitability Metrics
Access detailed profitability metrics with visual gauges and benchmarks
NOC (Northrop Grumman Corporation) is a Industrials company listed on New York Stock Exchange. The stock has generated 11.4% annual returns with an overall investment score of None/100.
Northrop Grumman demonstrates strong business quality through its significant backlog, financial performance, and technological innovation. Looking forward, growth prospects are bolstered by solid guidance, international expansion, and a focus on operational efficiencies. The overall outlook appears positive based on current trends and strategic initiatives.
NOC Key Financial Metrics
NOC financial analysis includes comprehensive valuation ratios, profitability metrics, and financial health indicators. The company has a valuation score of 9.382105591039517/100 and profitability score of 3.75/100 with financial health rated 7.45/100.
About Northrop Grumman Corporation
Northrop Grumman Corporation is a company that makes products for the aerospace and defense industries. They design and build various types of aircraft, including drones and fighter jets, which are used by military forces. They also create weapons systems and technology that help manage and control military operations. Additionally, they work on satellites and missile defense systems to protect against threats from space. Overall, Northrop Grumman plays a key role in ensuring safety and security through advanced technology.
NOC Investment Recommendation
Based on our comprehensive analysis of NOC, investors should consider the company's strong performance track record, earnings consistency (9/10 quarters beat expectations), and current valuation metrics when making investment decisions.
Industrials Sector Analysis
NOC operates in the Aerospace & Defense industry within the Industrials sector. This analysis compares Northrop Grumman Corporation performance against industry and sector benchmarks to provide context for investment decisions.
Frequently Asked Questions about NOC Stock
Is NOC a good investment?
NOC (Northrop Grumman Corporation) has generated 11.4% annual returns with an overall score of None/100. Northrop Grumman demonstrates strong business quality through its significant backlog, financial performance, and technological innovation. Looking forward, growth prospects are bolstered by solid guidance, international expansion, and a focus on … Investors should consider their risk tolerance and investment goals when evaluating NOC.
What is NOC P/E ratio and valuation?
NOC valuation metrics including P/E ratio, price-to-book ratio, and price-to-sales ratio are analyzed on this page with comparisons to Aerospace & Defense industry and Industrials sector benchmarks. The company currently has a valuation score of 9.382105591039517/100.
Should I buy NOC stock now?
The decision to buy NOC stock should be based on comprehensive analysis of financial metrics, market conditions, and individual investment goals. Our analysis provides profitability score of 3.75/100, financial health score of 7.45/100, and detailed performance metrics to help inform your investment decision.
What are NOC financial health indicators?
NOC financial health analysis includes liquidity ratios, debt levels, cash flow metrics, and profitability indicators. The company has a financial health score of 7.45/100 based on comprehensive analysis of balance sheet strength and operational efficiency.
How does NOC compare to competitors?
NOC performance is benchmarked against Aerospace & Defense industry peers and Industrials sector averages. Our analysis includes comparative valuation ratios, profitability metrics, and growth indicators to provide context for Northrop Grumman Corporation's market position.
What are NOC historical returns?
NOC has generated 11.4% annual returns over the 10Y. Historical performance analysis includes price appreciation, dividend yields, and total shareholder returns compared to market benchmarks.
NOC Key Investment Metrics Summary
Annual Return: 11.4%
Valuation Score: 9.382105591039517/100
Profitability Score: 3.75/100
Financial Health Score: 7.45/100
Growth Score: 10.600293602766074/100
Earnings Beat Rate: 9/10 quarters
Sector: Industrials
Industry: Aerospace & Defense
Exchange: New York Stock Exchange
Market Cap: 66311622300
NOC Investment Thesis
Northrop Grumman Corporation (NOC) represents a strong investment opportunity in the Industrials sector. With an overall score of None/100, the company demonstrates areas for financial improvement.
Investment Strengths
Attractive PE Ratio
Reasonable Price to Sales Ratio
Strong Return on Equity
Healthy Net Profit Margin
Strong Interest Coverage
Strong Backlog and Book-to-Bill Ratio
Financial Performance and Margin Expansion
Innovative Technology and Competitive Edge
Robust Growth Guidance
Increased International Sales
Focus on Efficiency and Technology Integration
Investment Risks
High Price to Cash Flow Ratio
Elevated EV to EBITDA Ratio
Moderate Operating Profit Margin
Low Gross Profit Margin
High Debt Levels
Liquidity Concerns
We use cookies to analyze site traffic and optimize your site experience.
By accepting, you consent to our use of cookies. Read our Privacy Policy to Learn more.