Lam Research demonstrates strong business quality through solid financial performance, strategic investments in R&D, and broad market exposure. However, customer concentration risks and uncertainties in the NAND market pose challenges. The company's future prospects are promising, driven by significant growth opportunities in NAND and AI technologies, although market conditions remain uncertain.
Analysis Date: January 29, 2025 Last Updated: May 29, 2025
+1370%
+30.8% per year
Past performance does not guarantee future results. The data presented is indicative and may not be updated in real-time.
CountryUS
ExchangeNASDAQ
IndustrySemiconductors
SectorTechnology
Market Cap$100.34B
CEOMr. Timothy M. Archer
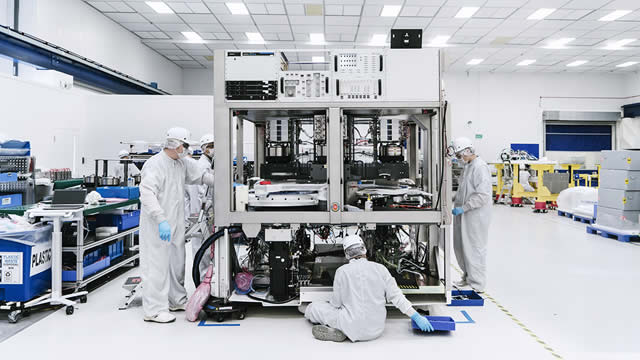
Lam Research Corporation makes tools and equipment used to create tiny computer chips, which are essential for all kinds of electronic devices like smartphones and computers. They provide machines that help build these chips by adding and shaping materials on the chip's surface. Lam Research sells its products and services to companies around the world that produce semiconductors. Founded in 1980 and based in Fremont, California, the company plays a key role in the technology industry.
Streams of revenue
System:57%
Customer Support and Other:43%
Geographic Distribution
CHINA:40%
KOREA, REPUBLIC OF:19%
TAIWAN, PROVINCE OF CHINA:16%
UNITED STATES:12%
JAPAN:8%
Europe:5%
Core Products
🔧
Etch SystemsPrecision etching tools
🧼
Clean SystemsWafer cleaning tech
🤝
Customer SupportTechnical assistance
📏
Metrology SystemsMeasurement solutions
🛠️
Deposition SystemsLayer deposition tools
Business Type
Business to Business
Competitive Advantages
Unlock Competitive Advantages Analysis
Discover all competitive advantages and strategic moats that protect LRCX's market position.
Trailing Twelve Months (TTM) values provide a view of the company's performance over the last year.
Graham Value Metrics
Benjamin Graham's value investing approach focuses on finding stocks with a significant margin of safety between their intrinsic value and market price.
📊
Unlock Graham value analysis
Access Benjamin Graham's value investing criteria, intrinsic value calculations, and margin of safety analysis
Trailing Twelve Months (TTM) values provide a view of the company's performance over the last year.
Income Statement Flow
Scroll horizontally to see more
About Profitability Metrics
Profitability metrics measure a company's ability to generate earnings relative to its revenue, operating costs, and other relevant metrics. Higher values generally indicate better performance.
📊
Unlock Profitability Metrics
Access detailed profitability metrics with visual gauges and benchmarks
LRCX Stock Analysis: Lam Research Corporation Investment Guide
LRCX (Lam Research Corporation) is a Technology company listed on NASDAQ Global Select. The stock has generated 30.8% annual returns with an overall investment score of None/100.
Lam Research demonstrates strong business quality through solid financial performance, strategic investments in R&D, and broad market exposure. However, customer concentration risks and uncertainties in the NAND market pose challenges. The company's future prospects are promising, driven by significant growth opportunities in NAND and AI technologies, although market conditions remain uncertain.
LRCX Key Financial Metrics
LRCX financial analysis includes comprehensive valuation ratios, profitability metrics, and financial health indicators. The company has a valuation score of 6.408840983203881/100 and profitability score of 7.5/100 with financial health rated 8.8/100.
About Lam Research Corporation
Lam Research Corporation makes tools and equipment used to create tiny computer chips, which are essential for all kinds of electronic devices like smartphones and computers. They provide machines that help build these chips by adding and shaping materials on the chip's surface. Lam Research sells its products and services to companies around the world that produce semiconductors. Founded in 1980 and based in Fremont, California, the company plays a key role in the technology industry.
LRCX Investment Recommendation
Based on our comprehensive analysis of LRCX, investors should consider the company's strong performance track record, earnings consistency (9/10 quarters beat expectations), and current valuation metrics when making investment decisions.
Technology Sector Analysis
LRCX operates in the Semiconductors industry within the Technology sector. This analysis compares Lam Research Corporation performance against industry and sector benchmarks to provide context for investment decisions.
Frequently Asked Questions about LRCX Stock
Is LRCX a good investment?
LRCX (Lam Research Corporation) has generated 30.8% annual returns with an overall score of None/100. Lam Research demonstrates strong business quality through solid financial performance, strategic investments in R&D, and broad market exposure. However, customer concentration risks and uncertainties in the NAND market pose challenges. … Investors should consider their risk tolerance and investment goals when evaluating LRCX.
What is LRCX P/E ratio and valuation?
LRCX valuation metrics including P/E ratio, price-to-book ratio, and price-to-sales ratio are analyzed on this page with comparisons to Semiconductors industry and Technology sector benchmarks. The company currently has a valuation score of 6.408840983203881/100.
Should I buy LRCX stock now?
The decision to buy LRCX stock should be based on comprehensive analysis of financial metrics, market conditions, and individual investment goals. Our analysis provides profitability score of 7.5/100, financial health score of 8.8/100, and detailed performance metrics to help inform your investment decision.
What are LRCX financial health indicators?
LRCX financial health analysis includes liquidity ratios, debt levels, cash flow metrics, and profitability indicators. The company has a financial health score of 8.8/100 based on comprehensive analysis of balance sheet strength and operational efficiency.
How does LRCX compare to competitors?
LRCX performance is benchmarked against Semiconductors industry peers and Technology sector averages. Our analysis includes comparative valuation ratios, profitability metrics, and growth indicators to provide context for Lam Research Corporation's market position.
What are LRCX historical returns?
LRCX has generated 30.8% annual returns over the 10Y. Historical performance analysis includes price appreciation, dividend yields, and total shareholder returns compared to market benchmarks.
LRCX Key Investment Metrics Summary
Annual Return: 30.8%
Valuation Score: 6.408840983203881/100
Profitability Score: 7.5/100
Financial Health Score: 8.8/100
Growth Score: 2.0415886169997486/100
Earnings Beat Rate: 9/10 quarters
Sector: Technology
Industry: Semiconductors
Exchange: NASDAQ Global Select
Market Cap: 100335306400
LRCX Investment Thesis
Lam Research Corporation (LRCX) represents an excellent investment opportunity in the Technology sector. With an overall score of None/100, the company demonstrates areas for financial improvement.
Investment Strengths
Attractive PE Ratio
Strong Price-to-Sales Ratio
Strong Return on Equity
Healthy Profit Margins
Strong Liquidity Ratios
Low Debt Levels
Strong Financial Performance
Strategic Investments in R&D
Diverse Market Exposure
Opportunities in NAND and DRAM Upgrades
Expansion in AI and Advanced Technologies
Investment Risks
High Price-to-Book Ratio
Customer Concentration Risks
Uncertainty in Market Conditions
Reliant Product Line Challenges
We use cookies to analyze site traffic and optimize your site experience.
By accepting, you consent to our use of cookies. Read our Privacy Policy to Learn more.