10Y annualized return is
negative
at -2.8% per year
CTRA has met or exceeded earnings expectations in
the majority of
recent quarters (7/10)
Attractive Price-to-Earnings Ratio
Reasonable Price-to-Book Ratio
Strong Profit Margins
Healthy Return on Equity
Strong Liquidity Ratios
Low Debt Levels
Strong Financial Performance
Flexibility in Capital Allocation
Successful Acquisitions
Robust Growth Outlook
Innovations in Operational Efficiency
Strong Market Positioning
High Price-to-Sales Ratio
Elevated EV/EBITDA
Moderate Operating Profit Margin
Moderate Interest Coverage
Caution in Gas Market
Coterra Energy demonstrates a strong business quality with effective financial management, operational flexibility, and successful integration of recent acquisitions. Future prospects appear promising with expected growth, operational innovations, and strategic positioning in the gas market, though caution remains regarding market fluctuations.
Analysis Date: February 25, 2025 Last Updated: March 11, 2025
-25%
-2.8% per year
Past performance does not guarantee future results. The data presented is indicative and may not be updated in real-time.
CountryUS
ExchangeNYSE
IndustryOil & Gas Exploration & Production
SectorEnergy
Market Cap$19.32B
CEOMr. Thomas E. Jorden
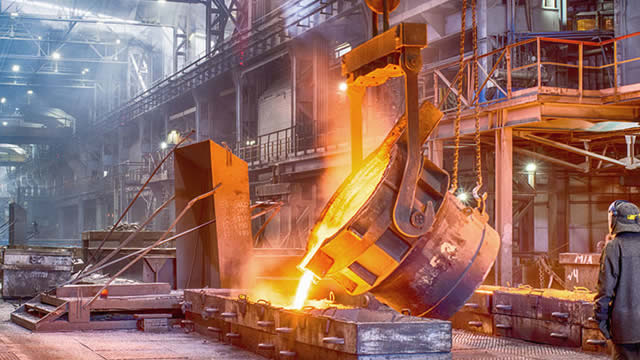
Coterra Energy Inc. is a company that finds and produces oil and natural gas in the United States. They mainly work in areas called the Marcellus Shale in Pennsylvania and the Permian Basin in Texas. Coterra sells the oil and gas they produce to different customers, including factories and power plants. In simple terms, they help provide energy that powers our homes and businesses.
Streams of revenue
Oil and Condensate:100%
Geographic Distribution
United States:76%
Canada:15%
Other:9%
Estimations for reference only
Core Products
🛢️
OilCrude oil supply
💧
NGLsNatural gas liquids
🔥
Natural GasEnergy resource
Business Type
Business to Business
Competitive Advantages
🔋
Proven ReservesCoterra's significant proved reserves of oil and natural gas provide a reliable source of revenue and lower risk in exploration.
📜
Long-Term ContractsEntering into long-term contracts with customers ensures a stable revenue stream and reduces exposure to volatile market prices.
⚙️
Operational EfficiencyCoterra's advanced drilling techniques and established infrastructure enhance production efficiency and cost management.
🏗️
Strategic InfrastructureOwnership of gathering systems and disposal facilities provides Coterra with logistical advantages and cost savings in transporting resources.
🌍
Geographic DiversificationThe company's operations across multiple prolific basins (Marcellus, Permian, and Anadarko) mitigate risks associated with regional market fluctuations.
Key Business Risks
🔧
Operational RisksChallenges in drilling, production, and equipment failures can disrupt operations and lead to financial losses.
🌍
Geopolitical RisksPolitical instability in oil-producing regions can affect supply chains and market dynamics.
🏁
Market CompetitionIntense competition from other energy producers may affect market share and pricing power.
⚖️
Regulatory ChangesChanges in environmental regulations and energy policies may increase operational costs or limit exploration.
📉
Commodity Price VolatilityFluctuations in oil and gas prices can significantly impact revenue and profitability.
Trailing Twelve Months (TTM) values provide a view of the company's performance over the last year.
Graham Value Metrics
Benjamin Graham's value investing approach focuses on finding stocks with a significant margin of safety between their intrinsic value and market price.
Intrinsic Value
Estimated fair value based on Graham's formula
$58.64
Current Market Price: $26.08
IV/P Ratio: 2.25x (>1.0 indicates undervalued)
Margin of Safety
Gap between intrinsic value and market price
56.00000000000001%
Graham recommended a minimum of 20-30% margin of safety
Higher values indicate a greater potential discount to fair value
Graham Criteria Checklist
Benjamin Graham's value investing checklist for CTRA
Positive earnings (5+ years)
Dividend history (5+ years)
P/E ratio ≤ 20 (16.49)
P/B ratio ≤ 1.5 (1.37)
Current ratio ≥ 2.0 (2.92x)
Long-term debt < Net current assets (1.68x)
Margin of safety (56.00000000000001%)
CTRA does not meet all Graham criteria
ROE: 8.516942713873272
ROA: None
Gross Profit Margin: 35.27344607950801
Net Profit Margin: 24.62112892598287
Trailing Twelve Months (TTM) values provide a view of the company's performance over the last year.
Income Statement Flow
Scroll horizontally to see more
About Profitability Metrics
Profitability metrics measure a company's ability to generate earnings relative to its revenue, operating costs, and other relevant metrics. Higher values generally indicate better performance.
Return on Equity (ROE)
Measures how efficiently a company uses its equity to generate profits
8.52%
10%15%
Higher values indicate better returns for shareholders
TTM (as of 2025-04-30)
Gross Profit Margin
Percentage of revenue retained after accounting for cost of goods sold
35.27%
20%40%
Higher values indicate better efficiency in production
TTM (as of 2025-04-30)
Net Profit Margin
Percentage of revenue retained after accounting for all expenses
Less than 1.0 is concerning, 1.0-2.0 is adequate, greater than 2.0 is good
Q4 2024
Financial Health Analysis
Strengths
Strong Liquidity Ratios
2.92
Current Ratio
2.88
Quick Ratio
CTRA has a current ratio of 2.92 and a quick ratio of 2.88, indicating excellent short-term liquidity and the ability to cover liabilities.
Low Debt Levels
0.28
Debt-to-Equity Ratio
With a debt-to-equity ratio of 0.28, CTRA maintains a conservative approach to leverage, minimizing financial risk.
Weaknesses
Moderate Interest Coverage
11.73
Interest Coverage Ratio
An interest coverage ratio of 11.73, while healthy, suggests that the company could face challenges if earnings decline significantly.
Historical Earnings Results
Meeting Expectations
7/10
Higher values indicate better execution and credibility
Recent Results
2025-02-24
+13.2%
2024-10-31
-5.9%
2024-08-01
-5.1%
2024-05-02
+24.4%
2024-02-22
-5.5%
2023-11-06
+13.6%
2023-08-07
+8.3%
2023-05-04
+24.3%
2023-02-22
+5.5%
2022-11-03
+3.6%
Earnings call from February 25, 2025
EPS
0.42
Estimated
0.49
Actual
+13.19%
Difference
Revenue
$1409337848
Estimated
$1395000000
Actual
%
Difference
Strengths
Strong Financial Performance
61%
Q4 Free Cash Flow Return
89%
Full Year Free Cash Flow Return
Coterra Energy achieved production levels above the high end of guidance, with a free cash flow return of 61% in Q4 2024 and 89% for the full year. This indicates strong capital efficiency and effective cash management.
Flexibility in Capital Allocation
Coterra maintains flexibility to pivot and reallocate capital based on market conditions, which allows for a responsive approach to changes in oil and gas prices.
Successful Acquisitions
The integration of Franklin Mountain and Avant acquisitions is expected to optimize capital and operational efficiency, enhancing the company's asset base.
Weaknesses
No weaknesses identified.
Opportunities
Robust Growth Outlook
5%+
Projected Oil Volume Growth (2025-2027)
Coterra anticipates 5% or greater oil volume growth from 2025 to 2027 and is prepared to increase Marcellus activity if gas market conditions continue to improve.
Innovations in Operational Efficiency
The company has achieved significant reductions in capital costs through longer lateral drilling and improved frac designs, allowing for more efficient use of capital.
Strong Market Positioning
Coterra is well-positioned to take advantage of improving natural gas market dynamics, with a focus on maximizing gas sales and exploring new markets.
Risks
Caution in Gas Market
Despite the positive outlook, management emphasizes a cautious approach to ramping up activity in the gas market, indicating uncertainty remains.
Insider trading data shows purchase and sale activities by company executives and board members.
Insider Sentiment Analysis
Insider trading patterns can provide insights into how company executives and board members view the stock's future prospects.
Insider buying and selling are relatively balanced (ratio: 0.99x)
Total Bought
Total value of insider purchases in recent quarters
Lower values relative to buying indicate possible undervaluation
Active Insiders
Number of insiders trading in recent quarters
24
High insider activity
Recent Trend
Change in insider trading pattern
CTRA: No trend data available
We use cookies to analyze site traffic and optimize your site experience.
By accepting, you consent to our use of cookies. Read our Privacy Policy to Learn more.