Chipotle demonstrates strong business quality with robust financial performance and operational efficiency. Future prospects remain promising with aggressive expansion and innovative strategies, but challenges in margins and market conditions could impact growth.
Analysis Date: February 4, 2025 Last Updated: May 29, 2025
+283%
+14.4% per year
Past performance does not guarantee future results. The data presented is indicative and may not be updated in real-time.
CountryUS
ExchangeNYSE
IndustryRestaurants
SectorConsumer Cyclical
Market Cap$80.12B
CEOMr. Scott Boatwright
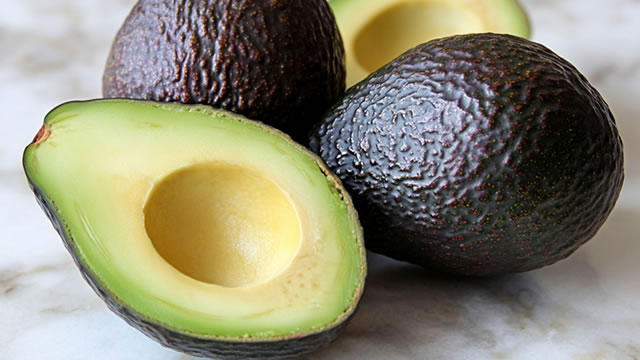
Chipotle Mexican Grill, Inc. is a restaurant company that makes and sells Mexican food, like burritos, tacos, and bowls. They have around 3,000 locations in several countries, including the United States and parts of Europe. Founded in 1993, Chipotle focuses on using fresh ingredients and allows customers to customize their meals. People enjoy their food for its flavor and the ability to choose what goes into their meal.
Streams of revenue
Chipotle Rewards:100%
Geographic Distribution
United States:95%
International:5%
Estimations for reference only
Core Products
🥗
BowlsRice and toppings
🌮
TacosCorn/flour shell
🥙
SaladsGreens and toppings
🌯
BurritosStuffed tortilla
🧀
QuesadillasCheese-filled wrap
Business Type
Business to Consumer
Competitive Advantages
Unlock Competitive Advantages Analysis
Discover all competitive advantages and strategic moats that protect CMG's market position.
Trailing Twelve Months (TTM) values provide a view of the company's performance over the last year.
Graham Value Metrics
Benjamin Graham's value investing approach focuses on finding stocks with a significant margin of safety between their intrinsic value and market price.
📊
Unlock Graham value analysis
Access Benjamin Graham's value investing criteria, intrinsic value calculations, and margin of safety analysis
Trailing Twelve Months (TTM) values provide a view of the company's performance over the last year.
Income Statement Flow
Scroll horizontally to see more
About Profitability Metrics
Profitability metrics measure a company's ability to generate earnings relative to its revenue, operating costs, and other relevant metrics. Higher values generally indicate better performance.
📊
Unlock Profitability Metrics
Access detailed profitability metrics with visual gauges and benchmarks
CMG Stock Analysis: Chipotle Mexican Grill, Inc. Investment Guide
CMG (Chipotle Mexican Grill, Inc.) is a Consumer Cyclical company listed on New York Stock Exchange. The stock has generated 14.4% annual returns with an overall investment score of None/100.
Chipotle demonstrates strong business quality with robust financial performance and operational efficiency. Future prospects remain promising with aggressive expansion and innovative strategies, but challenges in margins and market conditions could impact growth.
CMG Key Financial Metrics
CMG financial analysis includes comprehensive valuation ratios, profitability metrics, and financial health indicators. and profitability score of 3.75/100 with financial health rated 6.3999999999999995/100.
About Chipotle Mexican Grill, Inc.
Chipotle Mexican Grill, Inc. is a restaurant company that makes and sells Mexican food, like burritos, tacos, and bowls. They have around 3,000 locations in several countries, including the United States and parts of Europe. Founded in 1993, Chipotle focuses on using fresh ingredients and allows customers to customize their meals. People enjoy their food for its flavor and the ability to choose what goes into their meal.
CMG Investment Recommendation
Based on our comprehensive analysis of CMG, investors should consider the company's strong performance track record, earnings consistency (8/10 quarters beat expectations), and current valuation metrics when making investment decisions.
Consumer Cyclical Sector Analysis
CMG operates in the Restaurants industry within the Consumer Cyclical sector. This analysis compares Chipotle Mexican Grill, Inc. performance against industry and sector benchmarks to provide context for investment decisions.
Frequently Asked Questions about CMG Stock
Is CMG a good investment?
CMG (Chipotle Mexican Grill, Inc.) has generated 14.4% annual returns with an overall score of None/100. Chipotle demonstrates strong business quality with robust financial performance and operational efficiency. Future prospects remain promising with aggressive expansion and innovative strategies, but challenges in margins and market conditions could … Investors should consider their risk tolerance and investment goals when evaluating CMG.
What is CMG P/E ratio and valuation?
CMG valuation metrics including P/E ratio, price-to-book ratio, and price-to-sales ratio are analyzed on this page with comparisons to Restaurants industry and Consumer Cyclical sector benchmarks.
Should I buy CMG stock now?
The decision to buy CMG stock should be based on comprehensive analysis of financial metrics, market conditions, and individual investment goals. Our analysis provides profitability score of 3.75/100, financial health score of 6.3999999999999995/100, and detailed performance metrics to help inform your investment decision.
What are CMG financial health indicators?
CMG financial health analysis includes liquidity ratios, debt levels, cash flow metrics, and profitability indicators. The company has a financial health score of 6.3999999999999995/100 based on comprehensive analysis of balance sheet strength and operational efficiency.
How does CMG compare to competitors?
CMG performance is benchmarked against Restaurants industry peers and Consumer Cyclical sector averages. Our analysis includes comparative valuation ratios, profitability metrics, and growth indicators to provide context for Chipotle Mexican Grill, Inc.'s market position.
What are CMG historical returns?
CMG has generated 14.4% annual returns over the 10Y. Historical performance analysis includes price appreciation, dividend yields, and total shareholder returns compared to market benchmarks.
CMG Key Investment Metrics Summary
Annual Return: 14.4%
Profitability Score: 3.75/100
Financial Health Score: 6.3999999999999995/100
Growth Score: -1.5524249285733769/100
Earnings Beat Rate: 8/10 quarters
Sector: Consumer Cyclical
Industry: Restaurants
Exchange: New York Stock Exchange
Market Cap: 80120292000
CMG Investment Thesis
Chipotle Mexican Grill, Inc. (CMG) represents a strong investment opportunity in the Consumer Cyclical sector. With an overall score of None/100, the company demonstrates areas for financial improvement.
Investment Strengths
Strong Return on Equity
Solid Profit Margins
Adequate Liquidity Ratios
Strong Financial Performance
Digital Sales Growth
Efficient Operations and Culture
Expansion Plans
Innovative Technology Implementation
Brand Marketing Initiatives
Investment Risks
High Valuation Ratios
Operating Profit Margin
High Debt Levels
Interest Coverage Issues
Margin Pressures
Volatility in Comps
Inflation and Cost Challenges
Competing Against Tough Comparisons
We use cookies to analyze site traffic and optimize your site experience.
By accepting, you consent to our use of cookies. Read our Privacy Policy to Learn more.